Weft QDA : DIY CAQDAS
The following is only slightly adapted from the ‘Methods’ chapter of my MSc dissertation. I had a set of around a dozen unstructured interviews with credit union members, volunteers and staff, and around six months worth of fieldnotes from credit union meetings, events and field visits.
The origins of Weft QDA
I wished to use the assistance of a computer in the management of the substantial amount of data such as transcripts, field notes and photographs that I acquired during the fieldwork for this dissertation. Motivated initially by an unwillingness to hand over a three-figure sum for one of the commercially available pieces of CAQDAS, I decided to write my own using free tools. In the end, I produced a functional piece of software* that sufficed to carry out the analysis of the data gathered as described above. The application was primarily written in Ruby, a general-purpose programming language offering excellent text-handling capabiilties and supplementary resources for the creation of graphical user interfaces (GUIs) (Matsumoto et al. 2004; Thomas & Hunt 2000; Smith et al. 2004.
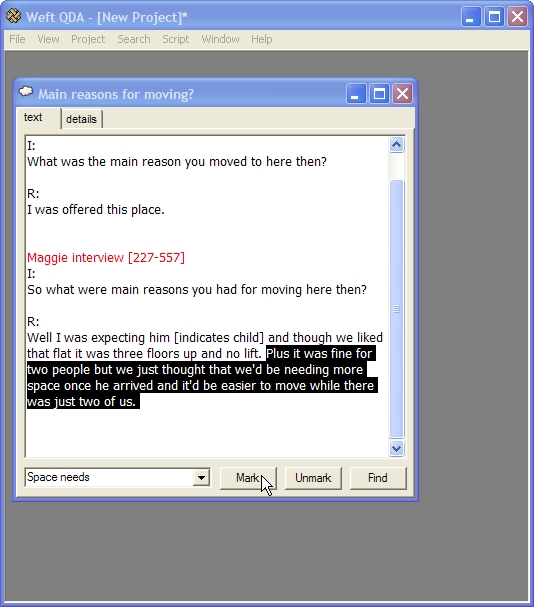
I wrote the software fairly naïvely, and this exposed the types of procedures I considered useful in my analysis. As the analysis progressed, I successively needed to implement several of the characteristic features of ‘code and retrieve’ packages, principally the ability to ‘mark’ disjoint sections of the data as related to one another. The passages I so coded were sometimes references to a particular activity, such as ‘payroll deduction’, or to a category used by interviewees, such as ‘word of mouth’. Sometimes they were narratives from my field notes or an interview. Although acknowledging that ‘coding’ as a primary activity in much CAQDAS is historically contingent, it is also an automisation of a generic interpretive procedure used in a wide range of disciplines and methodological traditions (Lee & Fielding 1996: ¶ 2.3-2.4; Kelle 1997: ¶ 2.4; see screenshot). The software does not impose assumptions about the epistemological status of the ‘things’ by which data is coded (Kelle 1997: ¶ 3.7, ¶ 4.5-4.8;
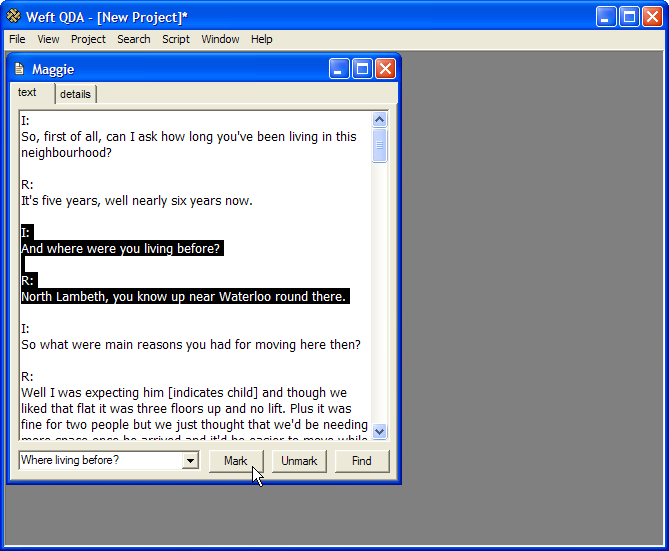
Refining of the software
However, as the analysis progressed, more sophisticated functions were required. This table presents a correspondence of analytic strategies with the software behaviours that supported them:
| Analytic Strategy | Software Behaviour |
|---|---|
| Identify and record commonalities and differences within codes | Present coded text and allow codes to be applied to this presentation |
| Check coded passages in discursive context - e.g. to assess effect of interview prompts | Enable user to jump to see coded text in original context |
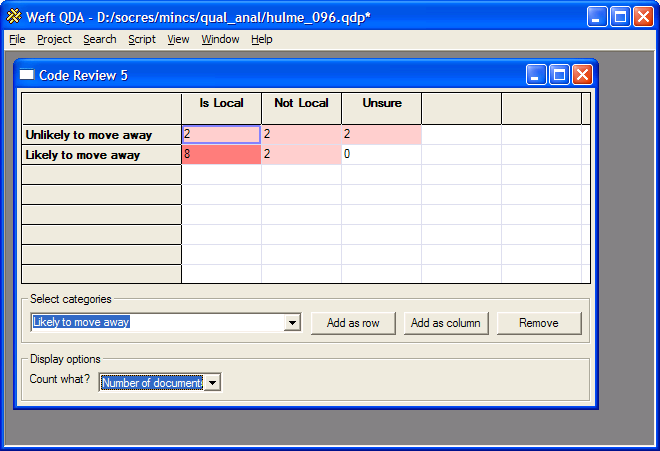
| Ascertain how well theories and categories are supported across whole data corpus | Provide statistics on code coverage; free-text search as alternate coding strategy |
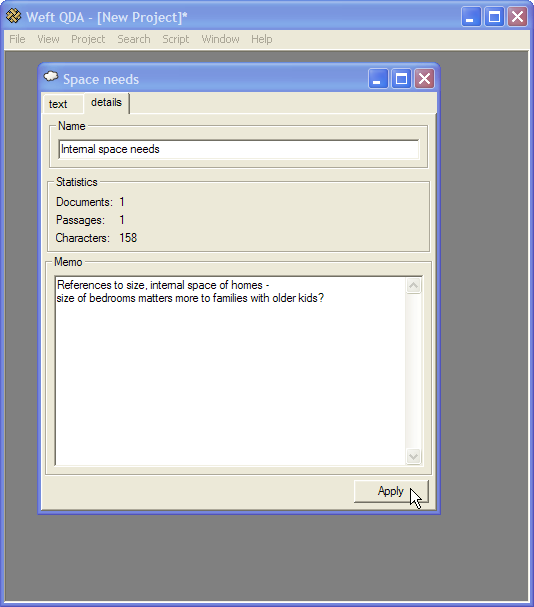
| Make reasoning behind codes explicit | Support attachment of user memoranda to codes |
Of course, all of these features are well described in the literature. Still, the omission of other features indicates approaches that were not used in this study. For example, I did not attempt statistical measures of the overlap of different codes; this would be indispensable for quantitative content analysis. There is no support for the import of structured text formats to support the exploration of the management of interaction by looking at timing, turn-taking and paralinguistic features (Muhr 2000: ¶ 4.1; see for example Lomax & Casey 1998).
Visual Conventions and Mental Models
Proponents of the use of CAQDAS generally assert that different packages may better suit certain analytic strategies, that most support a range of approaches, but that ‘none do your thinking for you’. Nonetheless, the economics of programming and the conventions of contemporary computer interfaces as a visual language do inescapably impinge upon the way an analysis is developed.
Consider the codes which are applied to the data, such as ‘payroll deduction’. As well the code having a relationship to the coded data (‘people talking about payroll deduction’), there is a desire to establish its relationship to other codes (‘payroll deduction in local authorities’) (Kelle 1997: ¶ 2.7). Therefore, CAQDAS usually provides a means for the user to visualise and perhaps manipulate these relationships between codes. One common spatial representation of this on the computer screen is the ‘tree’, which is a pervasive hierarchical organising principle in modern information systems, from the organisation of file systems, to application menu interfaces, to the navigation schemes of almost all larger websites. The expandable tree user interface element is not, of course, the only spatial representation of hierarchical organisation, but it is all the more compelling for the familiarity of the underlying organising principle. Furthermore, its pervasiveness is both a cause and a consequence of the availability of pre-written software resources to implement such a user interface element. This reduces the labour needed for an application developer to represent such relationships between codes as branches in a tree. This is the reason for the use of the tree in the software under discussion here.
The Limits of ‘Trees’
Whilst I have suggested that the relationship of code to data is undetermined, the use of such a tree both circumscribes the direction of relationships between codes and at the same time represents all those relationships in a visually homogeneous way. To return to the example given above, ‘payroll deduction in a local authority’ might seem to sit quite happily underneath ‘payroll deduction’, as a defined subset of examples of a general kind of empirically observed practice. Yet, at the same time, I might wish to relate it to the code non face-to-face transactions’. In this case, I am implying something rather different about the relationship, and I am starting to try to connect empirical categories of events to analytic themes. However, the spatialisation of codes as a tree does not make possible the representation of such complexity and qualitative variance in the relationship among the codes.
Individuals are capable of drawing diagrams by hand, whether of social theory or road directions that represent different kinds of complex relationships among the entities represented — likeness, proximity, priority, consequence and so on. However, the more abstract the relationships and entities so diagrammed — empirical-based typologies, ‘folk’ categories, theories — the more the selection of particular marks is idiosyncratic rather than conventionalised, and hence the more the diagram tends to depend on verbal or written explication for the meaning of its visual components to be correctly communicated to the viewer (Latour 2000; Ferguson 1997; for an example in software see Henderson 1995). Similarly, although like trees, the modelling of ‘networks’ as connected graphs is well understood algorithmically in computer science (for examples in Ruby see Fulton 2002: 186-202), there is, unlike for trees, no widely conventionalised idiom in contemporary user interface language for graphically presenting such complex relationships on a screen. Those applications such as Atlas.ti that do develop manipulable visualisations of complex networks require a substantially greater input of programmer labour. By their idiosyncracy such interfaces are less immediately usable to a researcher who is familiar with the interface conventions of other applications. Against this, of course, one does not expect all the operations of, say, a statistical package such as SPSS to be apparent from prior knowledge of conventionalised interface forms; some learning is assumed.
This is not to suggest that there is a definitive conclusion about ‘trees’ versus ‘networks’, nor to overstate the effect of the interface approaches of software, for as noted above, most users employ only the subset of the functions of an application that seems useful. However, the development of inter-code as well code-data relationships is a central activity in most qualitative analysis approaches. I have tried to show how the interfaces offered to researchers for this activity limit or permit the recording and visualisation of certain patterns and types of these relationships. We cannot separate the tools we use from their expression in wider computer user interface idioms, nor from the labour and market conditions of their production and exchange.